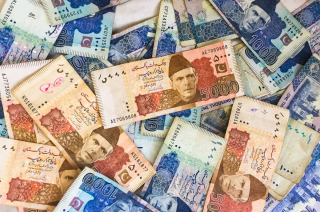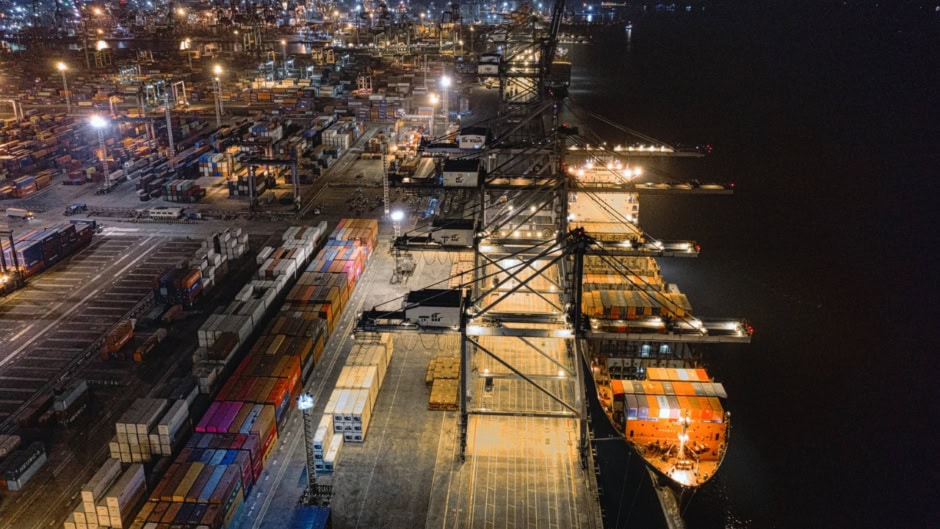
Pakistan recently recorded a massive surge in its national import bill. The total Pakistan import bill climbed to $5.87 billion in October 2026. This figure represents an 8.60% year-on-year increase from the $5.40 billion recorded in October 2025. The State Bank of Pakistan (SBP) officially released this data on November 17. However, total imports actually decreased by 4.74% on a monthly basis compared to the $6.16 billion recorded in September 2026.
Petroleum & Food Imports Dominate the Pakistan Import Bill for October 2026
The petroleum group remained the largest major import item for the country. Consequently, petroleum accounted for 27.24% of all total imports. The petroleum import bill stood at $1.60 billion. This marks a 19.27% year-on-year increase and a 2.00% monthly increase.
Meanwhile, the combined animal, vegetable, fats, and prepared foodstuffs groups totaled $723.95 million. This sector saw a 4.21% year-on-year drop and a 7.69% monthly decrease. Within this specific segment, oil seeds and oleaginous fruit imports surged 34.55% year-on-year to $170.53 million. Additionally, animal or vegetable fats and oils edged up slightly by 1.48% year-on-year to $348.73 million.
Machinery & Chemical Sector Imports Also Surged
Imports of machinery and mechanical appliances rose 4.81% year-on-year to $770.58 million. They did, however, drop 3.04% on a monthly basis. Base metals and articles also grew 16.63% year-on-year to $649.88 million. Specifically, iron and steel imports jumped 22.99% year-on-year to $492.35 million. Furthermore, vehicles and transport equipment surged 35.68% year-on-year to $367.95 million. Road vehicles alone accounted for $355.85 million of that transport total.
Textiles and textile articles imports increased 11.83% year-on-year to $478.05 million. Similarly, chemical and allied industries products jumped 18.53% year-on-year to $750.13 million. Notably, fertilizer imports more than doubled. They spiked 127.04% year-on-year to $185.51 million. Conversely, pharmaceutical products fell 13.66% year-on-year to $41.66 million. Finally, plastics and rubber imports rose 10.02% year-on-year to $328.00 million.
Here is a quick breakdown of the October 2026 import bill:
| Category | Import Value (Oct 2026) | YoY Change |
| Petroleum Group | $1.60bn | +19.27% |
| Machinery & Mechanical Appliances | $770.58m | +4.81% |
| Chemical & Allied Industries | $750.13m | +18.53% |
| Combined Food Groups | $723.95m | -4.21% |
| Base Metals & Articles | $649.88m | +16.63% |
| Textiles & Textile Articles | $478.05m | +11.83% |
| Vehicles & Transport Equipment | $367.95m | +35.68% |
| Plastics & Rubber | $328.00m | +10.02% |
| Fertilizers | $185.51m | +127.04% |
| Pharmaceutical Products | $41.66m | -13.66% |
| Total Imports | $5.87bn | +8.60% |
Cumulative Data for the Fiscal Year
On a cumulative basis, total imports reached $23.64 billion during the first four months of the fiscal year from July to October. This total reflects a 12.79% year-on-year increase compared to the $20.96 billion logged during the same period last year. Petroleum group imports stood at $5.91 billion during this timeframe, accounting for 25.01% of total imports.
The combined food groups recorded imports of $2.99 billion. Oil seeds and oleaginous fruit drove this growth by surging 69.56% year-on-year to $756.98 million. Machinery imports grew 9.36% year-on-year to $3.46 billion. Additionally, base metals and articles rose 25.01% year-on-year to $2.41 billion. Vehicles and transport equipment also increased 28.23% year-on-year to $1.52 billion. Textile imports went up 11.33% year-on-year to $1.93 billion. Lastly, chemical and allied industries products rose 7.19% year-on-year to $2.64 billion, with fertilizers seeing a 3.19% bump to $328.92 million.
Here is a quick breakdown of the cumulative FY27 imports (Jul-Oct):
| Category | Import Value (4MFY27) | YoY Change |
| Total Imports | $23.64bn | +12.79% |
| Petroleum Group | $5.91bn | +11.19% |
| Machinery | $3.46bn | +9.36% |
| Combined Food Groups | $2.99bn | +11.55% |
| Chemical & Allied Industries | $2.64bn | +7.19% |
| Base Metals & Articles | $2.41bn | +25.01% |
| Textiles | $1.93bn | +11.33% |
| Vehicles & Transport | $1.52bn | +28.23% |